Visualizing random priors on the simplex#
This tutorial shows how to use plot_simplex()
function to visualize how random probability vectors are sampled and
rounded to exact fractions. This is the same sampling used for
random priors in the tracing procedure.
The set of all probability vectors with three entries (non-negative numbers
that sum to 1) forms a triangle, called the unit simplex. Each probability
vector is a point in this triangle, and its corners are the vectors
\((1, 0, 0)\), \((0, 1, 0)\) and \((0, 0, 1)\).
plot_simplex() samples random points
from the simplex and draws two things:
the raw sampled points as green dots,
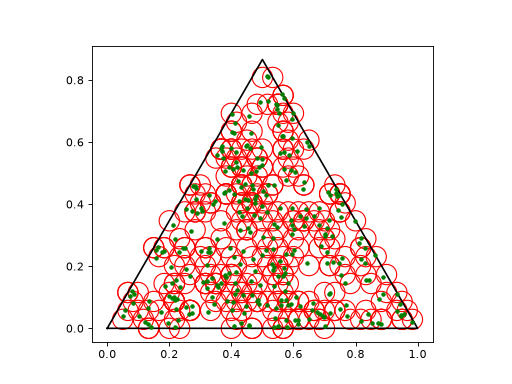
their rounded approximations as red circles.
The rounding turns each point into fractions with a common denominator
(accuracy) that still sum to exactly 1, which is needed for
the exact arithmetic in the algorithms.
A first plot#
import random
from lemke.randomstart import plot_simplex

random.seed(1)
plot_simplex(numpoints=300, accuracy=30)
random.seed is called first just to make the plot reproducible.
Every red circle sits on a grid point of the triangle, and each green dot
is rounded to a nearby grid point. With a small accuracy, the grid is
coarse, so many dots share one circle.
The function also prints the parameters it was called with:
numpoints=300 accuracy=30 higherdim=3 naiveplot=False
Changing the accuracy#
The accuracy is the denominator of the rounding: coordinates become
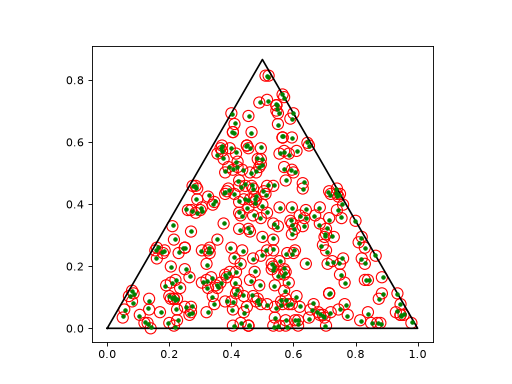
multiples of 1 / accuracy. Increasing it gives a finer grid, so the
red circles (which are also drawn smaller) lie closer to the dots:
import random
from lemke.randomstart import plot_simplex

random.seed(1)
plot_simplex(numpoints=300, accuracy=100)
Note
accuracy must be an integer between 1 and 10,000,000.
Uniform versus naive sampling#
By default the points are sampled uniformly from the simplex.
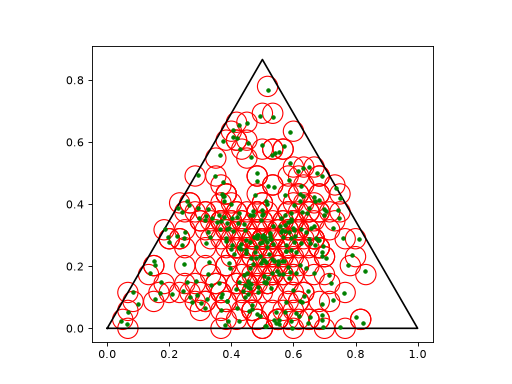
With naiveplot=True, points are instead sampled by normalizing
independent uniform random numbers. This is a common shortcut,
but it is not uniform. The points are denser near the centre
of the triangle and sparser near the corners:
import random
from lemke.randomstart import plot_simplex

random.seed(1)
plot_simplex(numpoints=300, accuracy=30, naiveplot=True)
Higher dimensions#
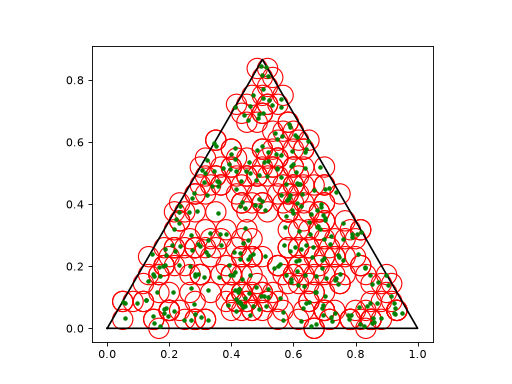
A triangle can only show three components. With higherdim argument greater
than 3, points are sampled from the higher-dimensional simplex, and only the
middle three components of each point are kept and renormalized to sum to 1.
import random
from lemke.randomstart import plot_simplex

random.seed(1)
plot_simplex(numpoints=300, accuracy=30, higherdim=6)
The function also prints which positions are shown:
numpoints=300 accuracy=30 higherdim=6 naiveplot=False
show positions 2 .. 4 of 0 .. 5
Note
higherdim must be an integer between 3 and 10.